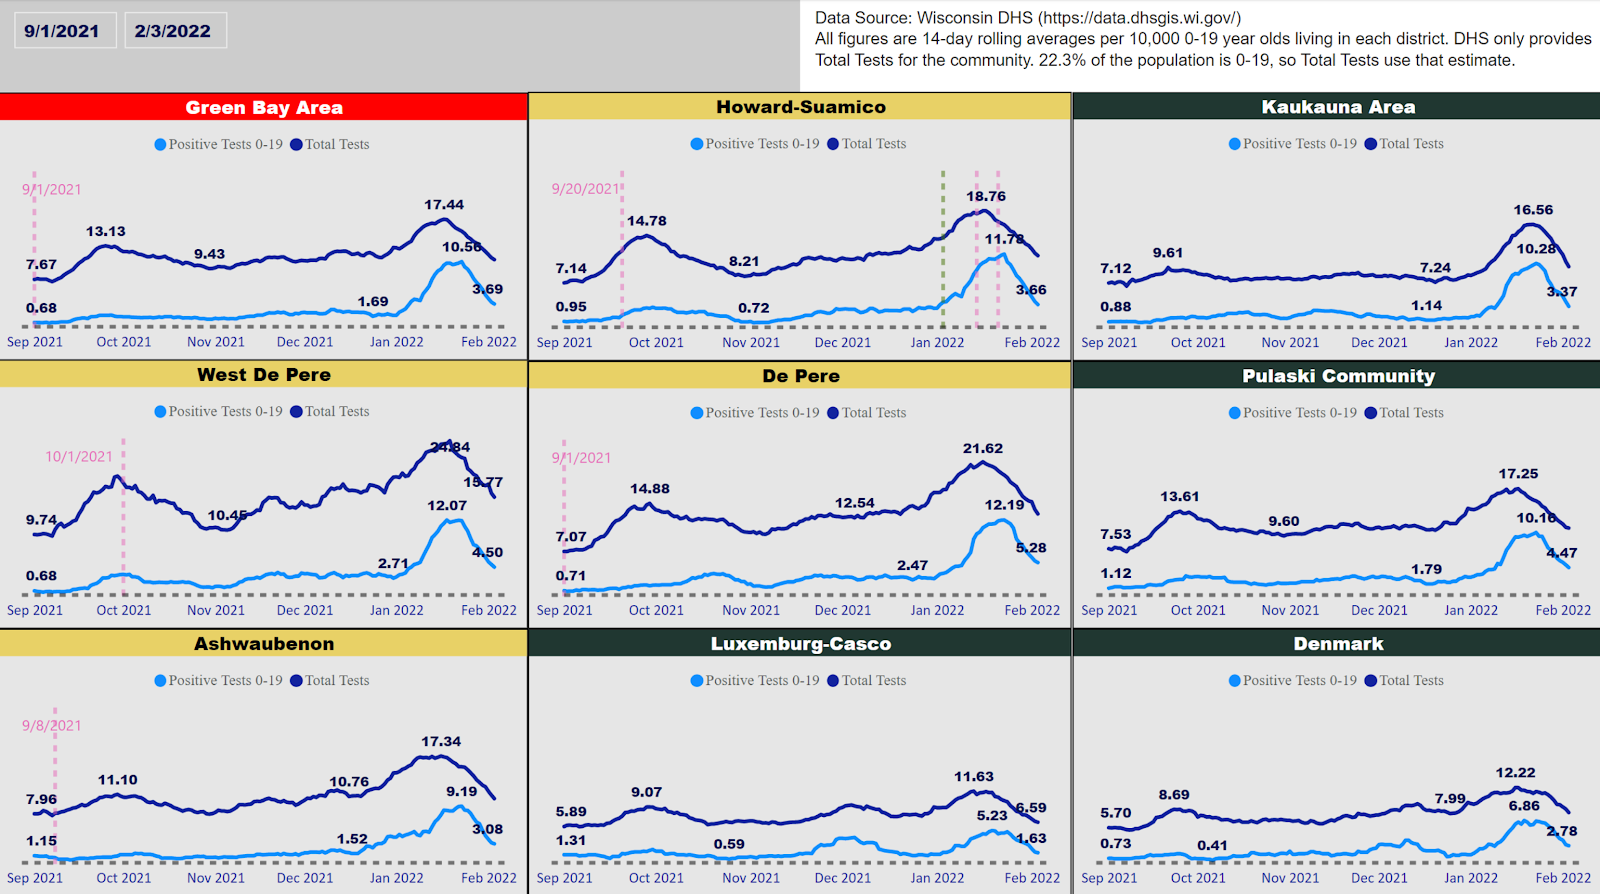
We've got about a week until the February 15th Primary here in Howard-Suamico, where six of the nine candidates will be selected by YOU - the voters!
Now, the reason I'm going to cover this topic one last time is because it drives home the fact that parents have done an outstanding job this school year as it relates to keeping your kids healthy and in school. It also underscores the fact that absent a compelling reason, parents are the ones that determine what is best for their child.
Today, February 7th, the HSSD dashboard shows we have seven (7) students out with positive tests, in a district of nearly 6,000 students.
Howard-Suamico Dashboard
Since early January, all leading indicators were pointing towards a downward trend in cases. The following graph is a computation called Rt: "the average number of people who will become infected by a person infected at time t. If it’s above 1.0, C19 cases will increase in the near future. If it’s below 1.0, C19 cases will decrease in the near future."
Rt for Brown County
Rt has proven to be a solid leading indicator once again. But I don't rely on predictive analysis in isolation, so then I'd do analysis on DHS data. I had to keep in mind that the data out of S. Africa and the U.K. indicated that the variant was quite contagious, but was not resulting in the same levels of severe illness as prior variants. At the same time, testing was being promoted at all levels of government and healthcare. I knew it would be problematic when I saw the district had instituted a 3% school-level threshold invoking masking for two weeks, which was breeched by both Lineville and Howard Elementary. One of the core reasons was because DHS includes "probable cases", which would include at-home rapid tests, for example. Those tests are known to be inaccurate.
DHS Data, By District for ages 0-19
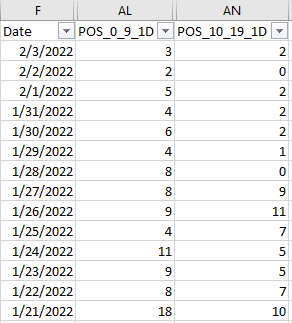
You may wonder, what do the values on the graph mean? Well, those are the y-axis values, which is why I removed that axis on each of the nine graphs. The February 3rd value of 3.66 for "Positive Tests 0-19" on the Howard-Suamico graph is calculated as follows:
Those are raw positive case counts for 14 days. POS_0_9_1D is the daily positive cases for ages 0-9, for example. If you take the average, you'll get 7.07 and 4.50 for children ages 0-9 and 10-19, respectively. In order to compare districts of varying sizes, we need a common denominator. For school districts it makes sense to use "per 10,000", whereas DHS uses "per 100,000" for county calculations. Howard-Suamico has 31,658 residents, so what we will get is a 10,000 resident cross-section of the district with equal distribution of ages.
(7.07 x 10,000) / 31,658 = 2.23 cases per 10,000 children 0-9 years old
(4.50 x 10,000) / 31,658 = 1.42 cases per 10,000 children 10-19 years old
Now, if you add 2.23 + 1.42, low and behold you'll have 3.65 (rounding puts it at
3.66). Worth noting, I obtain the residential population of each district from the DHS vaccination data file. So those are all per DHS as well.
So there you have it. I don't touch a digit of data from DHS. What I did was compare adjacent school districts to see whether policies were effective or not. If you look at the graphs, you will see that regardless of policy, masks required or masks optional, all of the trends were the same.


No comments:
Post a Comment